Note
Go to the end to download the full example code
The Multiscale class: representing a shape at different scales#
This notebook describes the Multscale class, class for representing a shape at multiple scale and conserving signals, landmarks and control points across scales.
Load a mesh from pyvista examples#
and add landmarks, point_data and control points
from pyvista import examples
import pyvista as pv
import skshapes as sks
# sphinx_gallery_thumbnail_number = 4

cpos = [(0.07817110755919496, 0.13558926405422117, 0.5210700195677971),
 (-0.01684039831161499, 0.11015420686453581, -0.0015369504690170288),
 (-0.26589633341798463, 0.9640005779198042, 0.0014232516134205578)]

cpos_multi = [(0.2445506282736577, 0.20944467997782604, 1.5201061830384905),
 (-0.01684039831161499, 0.11015420686453581, -0.0015369504690170288),
 (-0.41802782922478116, 0.9083476928315267, 0.012538058911154365)]

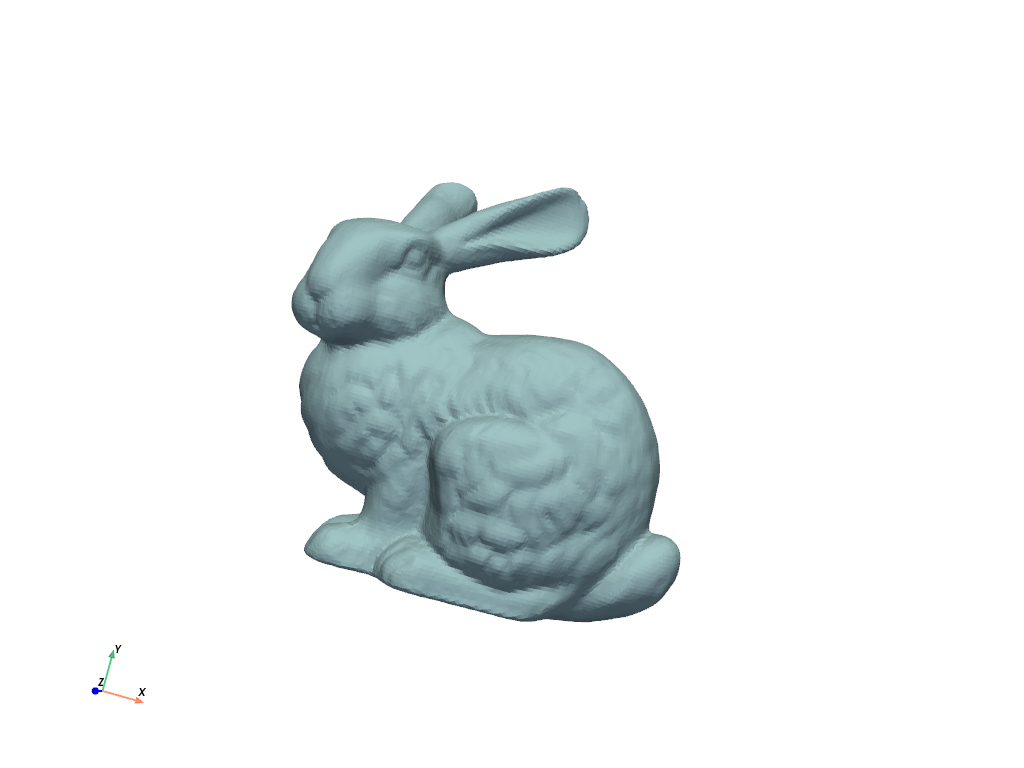
bunny = sks.PolyData(examples.download_bunny())
bunny.plot(cpos=cpos)

if not pv.BUILDING_GALLERY:
    # If not in the gallery, we can use vedo to open the landmark setter
    # Setting the default backend to vtk is necessary when running in a notebook
    import vedo
    vedo.settings.default_backend= 'vtk'
    sks.LandmarkSetter(bunny).start()
else:
    # Set the landmarks manually
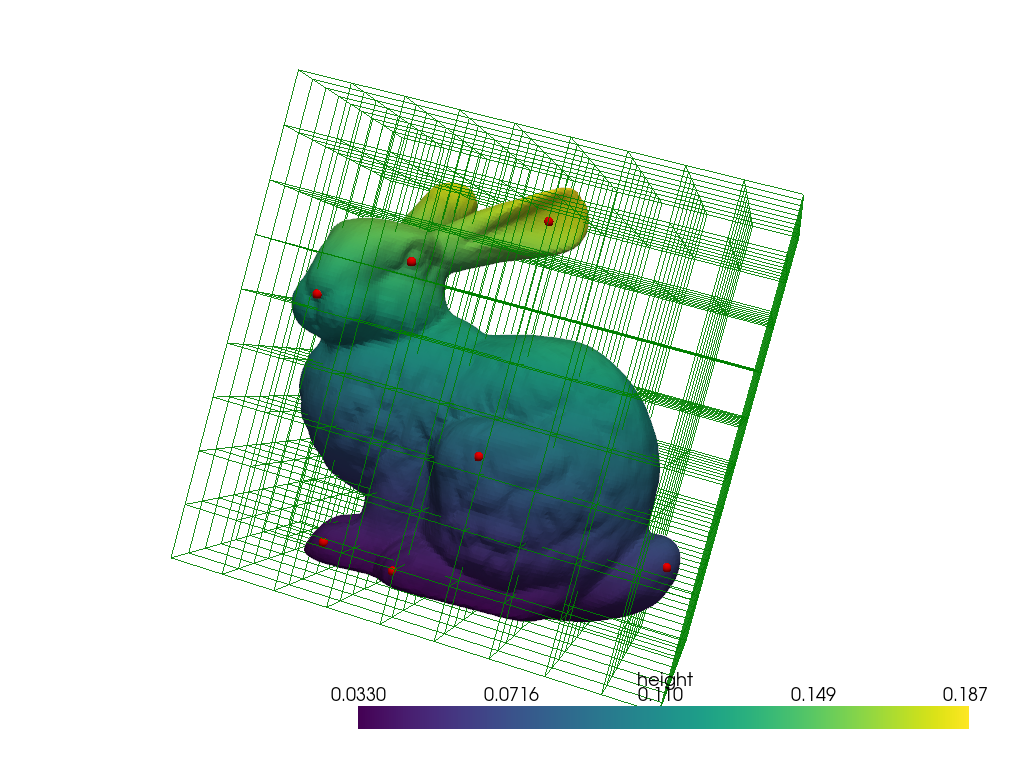
    bunny.landmark_indices = [ 4695, 12902,  1368, 13223,  5460, 20809, 12829, 10080, 30769, 27127, 21764, 23356]


# Add signal to point_data
bunny.point_data["height"] = bunny.points[:, 1]

# Add control points
bunny.control_points = bunny.bounding_grid(N=10, offset=0.05)

# Plot
plotter = pv.Plotter()
plotter.add_mesh(bunny.to_pyvista(), scalars="height")
plotter.add_points(bunny.landmark_points.numpy(), color="red", point_size=10, render_points_as_spheres=True)
plotter.add_mesh(bunny.control_points.to_pyvista(), color="green", opacity=0.9)
plotter.camera_position = cpos
plotter.show()

Create a Multiscale object#
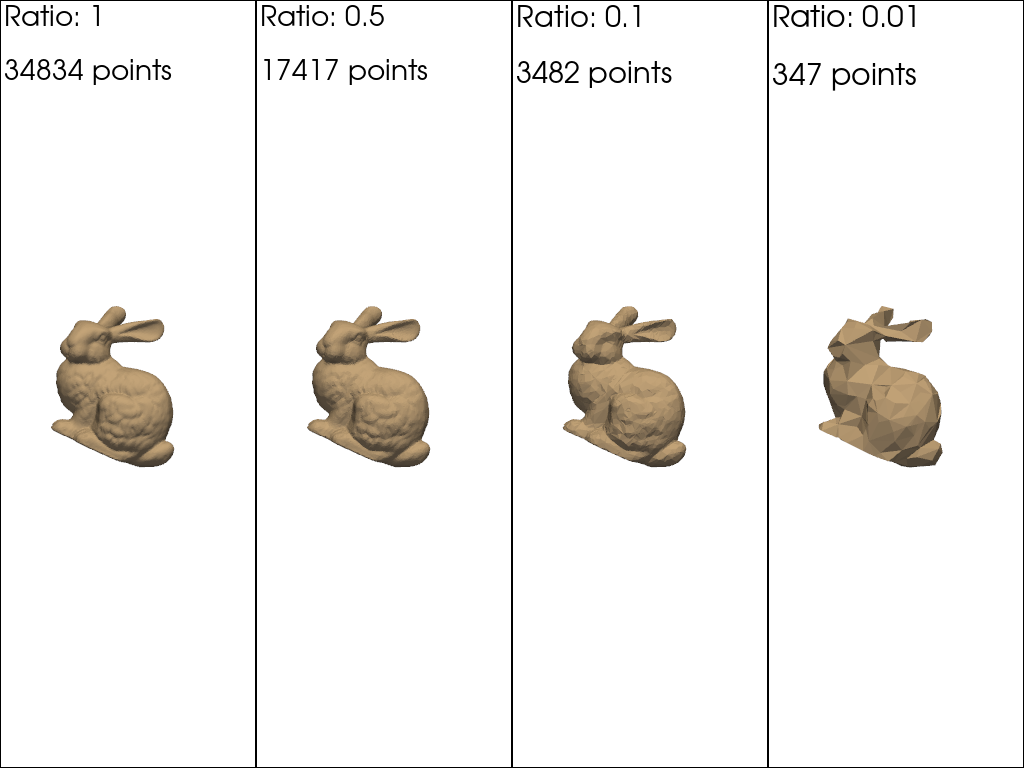
from a collection of ratios. Multiscale can also be initialized with n_points. %%
ratios = [0.5, 0.1, .01]
multimesh = sks.Multiscale(bunny, ratios=ratios)

plotter = pv.Plotter(shape=(1, 4))
for i, ratio in enumerate([1] + ratios):
    plotter.subplot(0, i)
    plotter.add_mesh(multimesh.at(ratio=ratio).to_pyvista(), color="tan")
    plotter.add_text(f"Ratio: {ratio}\n\n{multimesh.at(ratio=ratio).n_points} points", font_size=16)
    plotter.camera_position = cpos_multi

plotter.show()

Features preservation#
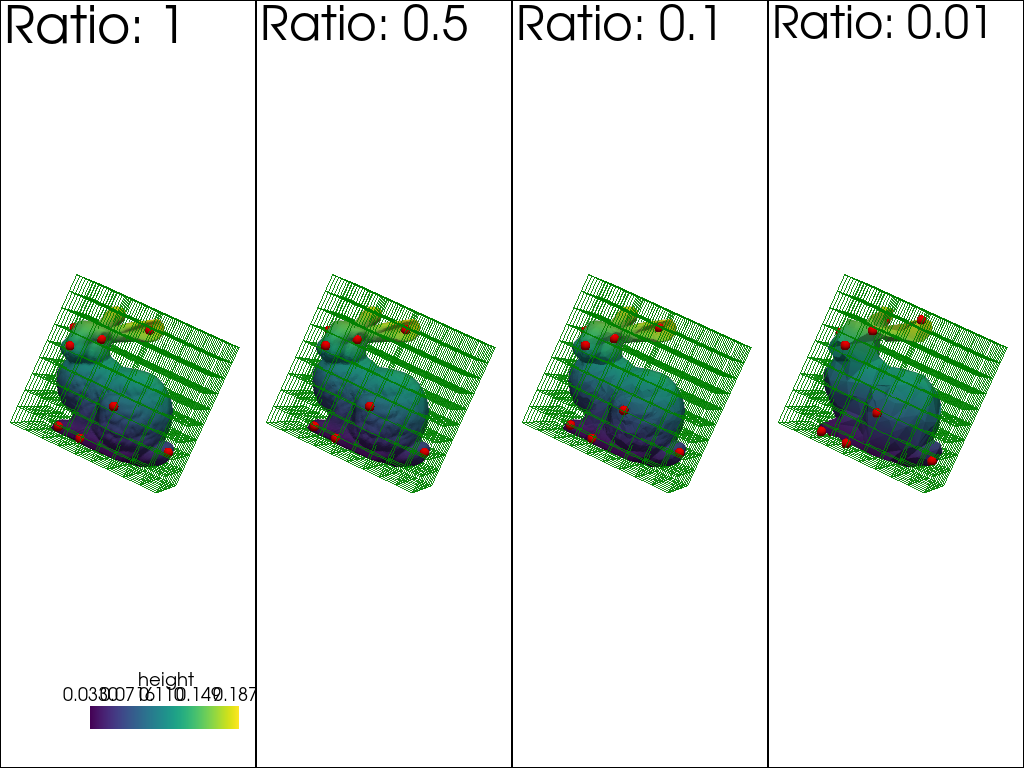
Landmarks are automatically propagated to the different scales
Signal can be propagated using a FineToCoarsePolicy
Control points must be set manually at coarse scales
policy = sks.FineToCoarsePolicy(reduce="mean")
multimesh.propagate(signal_name="height", from_ratio=1)

for ratio in ratios:
    multimesh.at(ratio=ratio).control_points = multimesh.at(ratio=1).control_points

plotter = pv.Plotter(shape=(1, 4))
for i, ratio in enumerate([1] + ratios):
    plotter.subplot(0, i)
    plotter.add_mesh(multimesh.at(ratio=ratio).to_pyvista(), scalars="height")
    plotter.add_points(multimesh.at(ratio=ratio).landmark_points.numpy(), color="red", point_size=10, render_points_as_spheres=True)
    plotter.add_mesh(multimesh.at(ratio=ratio).control_points.to_pyvista(), color="green", opacity=0.9)
    plotter.add_text(f"Ratio: {ratio}", font_size=24)
    plotter.camera_position = cpos_multi

plotter.show()

Total running time of the script: (0 minutes 3.544 seconds)