Note
Go to the end to download the full example code
The Registration class: rigid alignment#
This notebook is a first example with the registration class. We apply rigid registration to a pair of 3D shapes with different topologies.
A registration is defined by :
a model: the model defines the transformation to apply to the source shape (\(\text{morph}\)) and an associated regularization term (\(\text{reg}\))
a loss: the loss function measures the discrepency between the target shape and the transformed source shape.
a weight for the regularization term: \(\lambda\):.
If \(X\) is the source shape, \(Y\) the target shape, the criterion to optimize is:
The other parameters are the optimizer, the number of iterations and the verbosity level.
Load and preprocess data#
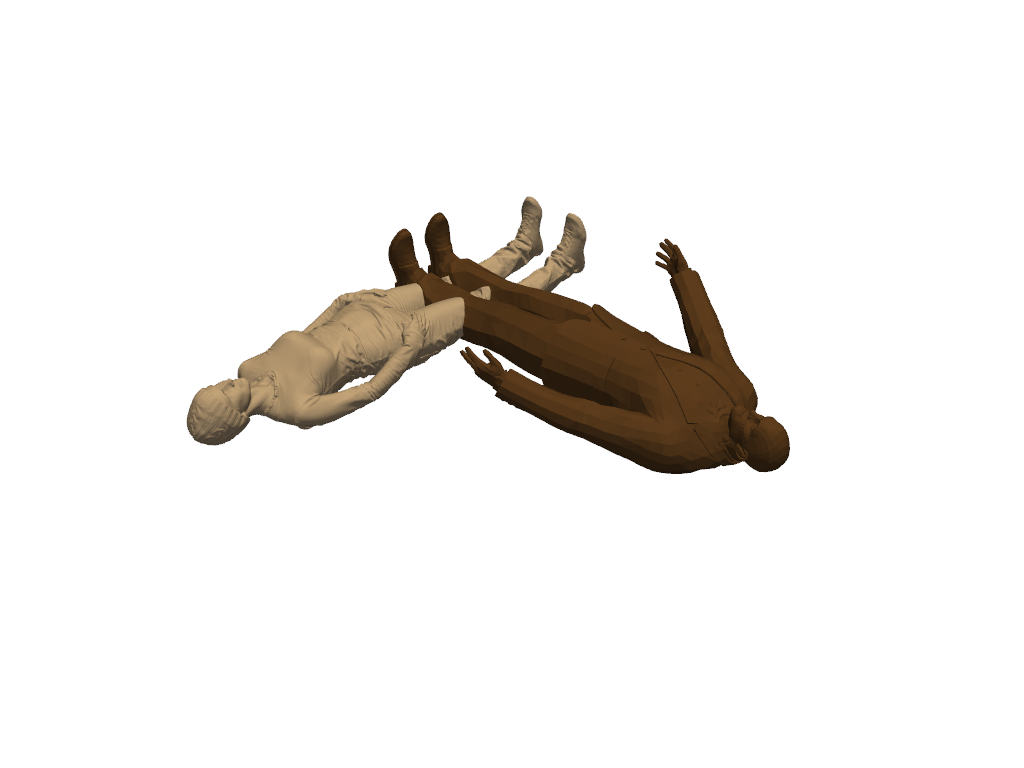
Load two triangle meshes from pyvista examples and rescale them to fit in the unit box.
import pykeops
import pyvista as pv
import torch
from pyvista import examples

import skshapes as sks

color_1 = 'tan'
color_2 = 'brown'

# shape1 = sks.PolyData(examples.download_human())
shape1 = sks.PolyData(examples.download_woman().rotate_y(90))
shape2 = sks.PolyData(examples.download_doorman())
shape1.point_data.clear()
shape2.point_data.clear()

def bounds(shape):
    return torch.max(shape.points, dim=0).values - torch.min(shape.points, dim=0).values

lims1 = bounds(shape1)
lims2 = bounds(shape2)
rescale1 = torch.max(lims1)
shape1.points -= torch.min(shape1.points, dim=0).values
shape1.points /= rescale1

rescale2 = torch.max(lims2)
shape2.points -= torch.min(shape2.points, dim=0).values
shape2.points /= rescale2

plotter = pv.Plotter()
plotter.add_mesh(shape1.to_pyvista(), color=color_1)
plotter.add_mesh(shape2.to_pyvista(), color=color_2)

plotter.show()

/opt/hostedtoolcache/Python/3.11.8/x64/lib/python3.11/site-packages/skshapes/input_validation/converters.py:102: UserWarning: Mesh has been cleaned and points were removed. point_data is ignored.
  return func(*new_args, **kwargs)
Run rigid registration#
As points are not ordered in the same way in the two shapes, we use the sks.NearestNeighborsLoss, it is the mean L2 distance between the closest points in the two shapes. Another possibility is to use the sks.OptimalTransportLoss which adds a term to the loss function to minimize the distance
loss = sks.NearestNeighborsLoss()
model = sks.RigidMotion()

registration = sks.Registration(
    model=model,
    loss=loss,
    n_iter=2,
    verbose=True,
) # default optimizer is torch.optim.LBFGS

registration.fit(source=shape2, target=shape1)
morph = registration.transform(source=shape2)

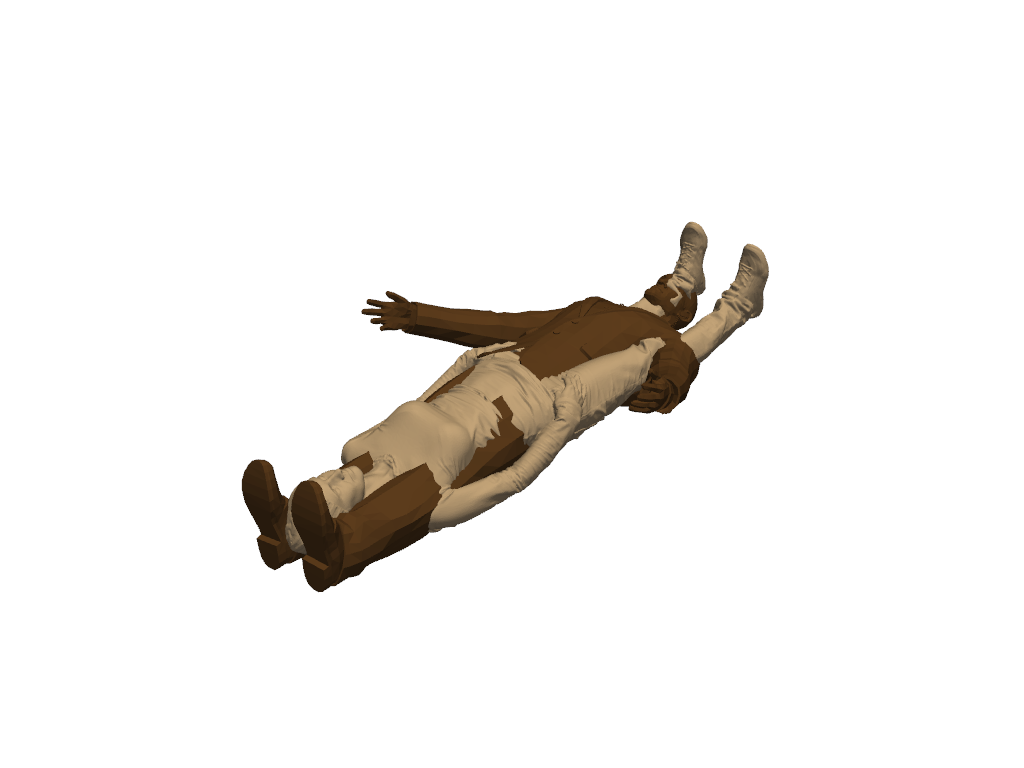
plotter = pv.Plotter()
plotter.add_mesh(shape1.to_pyvista(), color=color_1)
plotter.add_mesh(morph.to_pyvista(), color=color_2)
plotter.show()

Initial loss : 4.28e-01
  = 4.28e-01 + 1 * 0.00e+00 (fidelity + regularization_weight * regularization)
Loss after 1 iteration(s) : 1.45e-01
  = 1.45e-01 + 1 * 0.00e+00 (fidelity + regularization_weight * regularization)
Loss after 2 iteration(s) : 4.74e-02
  = 4.74e-02 + 1 * 0.00e+00 (fidelity + regularization_weight * regularization)
Add landmarks#
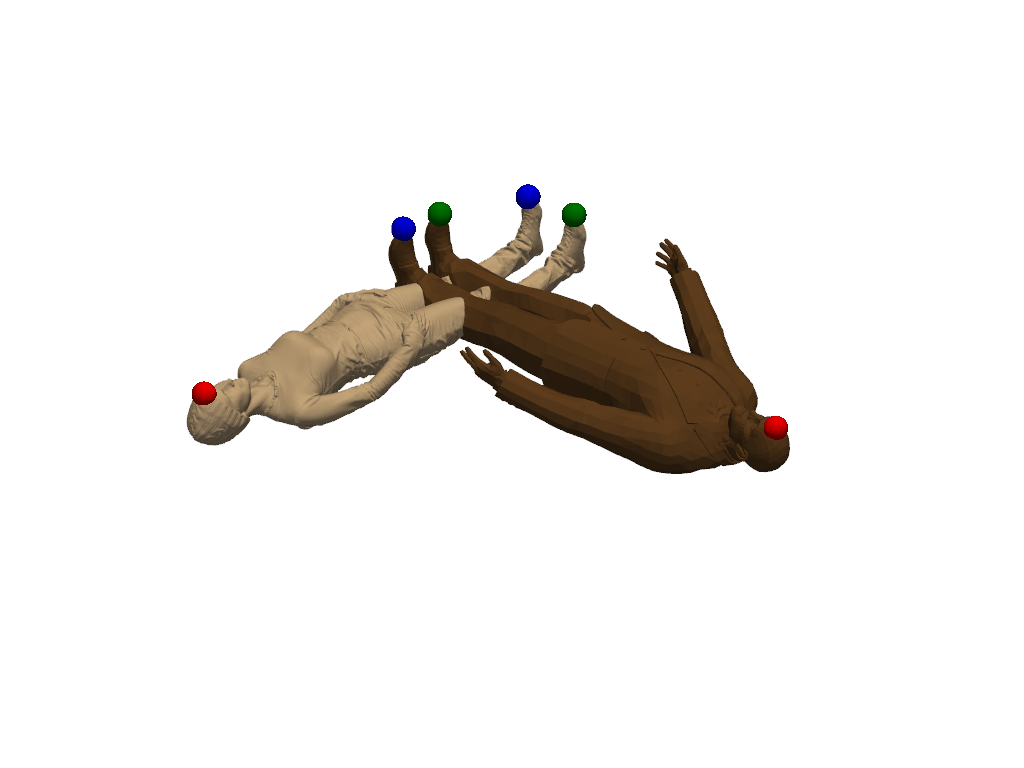
The registration did not work well. Shapes were matched upside down. With a few landmarks we can help the registration algorithm to find a better transformation.
# %%
if not pv.BUILDING_GALLERY:
    # If not in the gallery, we can use vedo to open the landmark setter
    # Setting the default backend to vtk is necessary when running in a notebook
    import vedo
    vedo.settings.default_backend= 'vtk'
    sks.LandmarkSetter([shape1, shape2]).start()
else:
    # Set the landmarks manually
    landmarks1 = [4808, 147742, 1774]
    landmarks2 = [325, 2116, 1927]

    shape1.landmark_indices = landmarks1
    shape2.landmark_indices = landmarks2

colors = ["red", "green", "blue"]
plotter = pv.Plotter()
plotter.add_mesh(shape1.to_pyvista(), color=color_1)
for i in range(len(shape1.landmark_indices)):
    plotter.add_points(
        shape1.landmark_points[i].numpy(),
        color=colors[i % 3],
        render_points_as_spheres=True,
        point_size=25,
    )
plotter.add_mesh(shape2.to_pyvista(), color=color_2)
for i in range(len(shape2.landmark_indices)):
    plotter.add_points(
        shape2.landmark_points[i].numpy(),
        color=colors[i % 3],
        render_points_as_spheres=True,
        point_size=25,
    )
plotter.show()

Register again with a loss that includes landmarks#
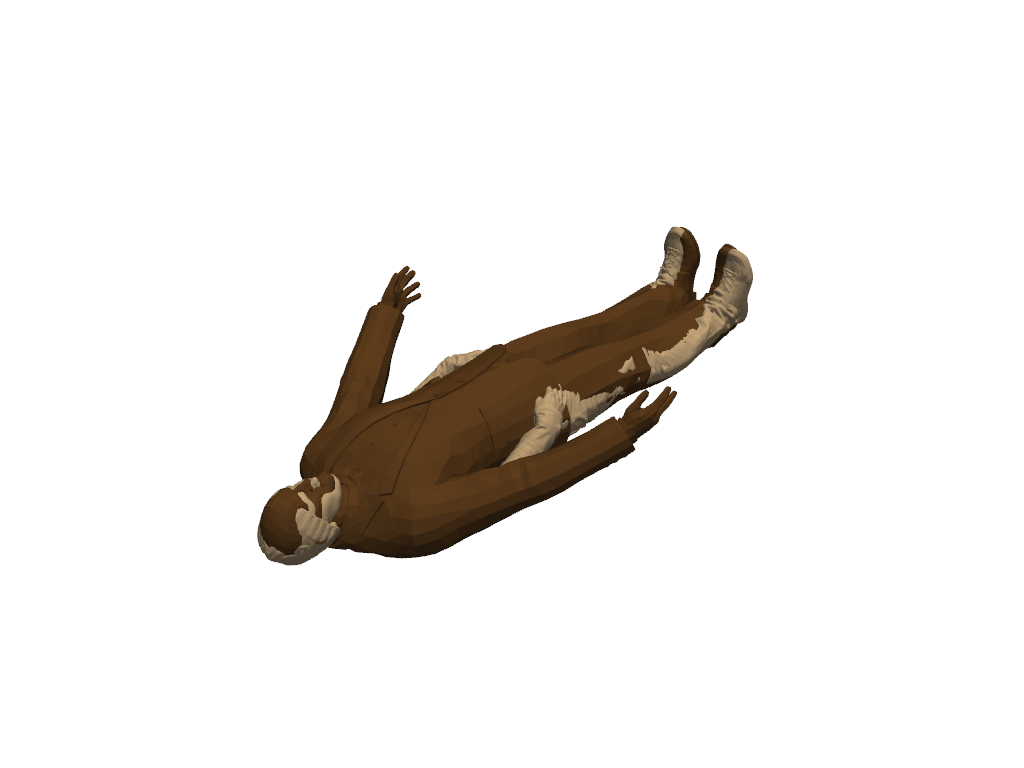
Now the loss is the sum of NearestNeighborsLoss and LandmarkLoss, the mean L2 distance between the landmarks in the two shapes.
loss_landmarks = sks.NearestNeighborsLoss() + sks.LandmarkLoss()

registration = sks.Registration(
    model=model,
    loss=loss_landmarks,
    n_iter=2,
    verbose=True,
)

registration.fit(source=shape2, target=shape1)
morph = registration.transform(source=shape2)

plotter = pv.Plotter()
plotter.add_mesh(shape1.to_pyvista(), color=color_1)
plotter.add_mesh(morph.to_pyvista(), color=color_2)
plotter.show()

Initial loss : 1.58e+00
  = 1.58e+00 + 1 * 0.00e+00 (fidelity + regularization_weight * regularization)
Loss after 1 iteration(s) : 7.36e-02
  = 7.36e-02 + 1 * 0.00e+00 (fidelity + regularization_weight * regularization)
Loss after 2 iteration(s) : 7.13e-02
  = 7.13e-02 + 1 * 0.00e+00 (fidelity + regularization_weight * regularization)
Total running time of the script: (0 minutes 57.706 seconds)